


近未来的なデバイスと言えば、よくSF映画などで目にする透明OLEDモジュール、いわゆる背面が透けているディスプレイが有名です。
また最近は、2024年1月のBTCのETF承認や4月の半減期を筆頭に空前の仮想通貨ブームが到来しています。
本記事では、そんな2大トレンドを組み合わせ近未来的な仮想通貨チャートデバイスの作成方法を紹介します。
透明OLEDモジュールのセットアップに関しては下記記事で詳しく紹介しています。
私は Raspberry Pi 3 Model B+ を使用していますが、最新は Raspberry Pi 5 がリリースされています。
目次
1. 透明OLEDモジュールとは?
OLEDとはOrganic Light Emitting Diode(有機発光ダイオード)の略で電気を流すと自身で発光する素子のことです。
OLEDを用いたディスプレイは液晶ディスプレイとは異なり背面からライトを照射する必要がないため省スペース・軽量化が見込めるモジュールとして、現在では様々な製品で活用されています。
近年では、このバックライトレスの特徴から背面が透けているディスプレイに応用されています。
2. CoinGeckoとは?
全ての人が、簡単に仮想通貨に関するデータにアクセスできる環境を提供するサイトです。
代表的なBTCに加え、ETH、SHIBなど様々な仮想通貨の価格や時価総額、チャートなどのデータを確認することができます。
CoinGecko
仮想通貨価格、チャート、仮想通貨時価総額 | CoinGecko
今回はネット上で仮想通貨に関する情報を参照するのではなく、Pythonを用いて透明OLEDモジュール上にリアルタイムでチャートを表示する方法を紹介します。
3.Python + CoinGeckoの使い方
3.1. 識別IDの確認方法
仮想通貨の情報をCoinGeckoから取得するためには該当通貨の識別IDが必要です。識別IDもCoinGeckoから取得することができるので、まずはその方法を紹介します。
下記PythonプログラムはBTC/ETH/XRP/MONA/SHIBの識別IDをCoinGeckoから取得するプログラムです。
シンボルを変更することで任意の仮想通貨の識別IDを取得することができます。
import requests

URL = "https://api.coingecko.com/api/v3"
#/coins/list (コインの種類を取得)
endpoint = "/coins/list"
url = URL + endpoint
response = requests.request("GET", url)
r = response.json()
symbol = ['btc','eth','grt', 'xrp','mona','shib']
for i in r:
  if i['symbol'] in symbol:
    print('%s : %s' %(i['symbol'], i['id']))
実行結果は下記になります。
・・・
btc : bitcoin
・・・
eth : ethereum
・・・
mona : mona
・・・
xrp : ripple
・・・
shib : shiba-inu
・・・
途中省略していますが、各仮想通貨の識別IDが取得できました。
CoinGeckoでは上記識別IDを指定することにより、該当仮想通貨の詳細データの取得を行います。
3.2. 仮想通貨詳細データの取得方法
前節で確認した識別IDを用いて仮想通貨の詳細データを取得します。
論より証拠!まずは下記コードを参照ください。
import requests
import json

# List.
str_list = ['shiba-inu', 'SHIB']

# CoinGecko URL Settings.
url = 'https://api.coingecko.com/spi/v3/coins/'+str_list[0]+'/market_chart'

# CoinGecko API Parameter.
params = {
    'vs_currency': 'jpy',    # currency unit:JPY.
    'days': 7                # last 7days data.
}

# Get CoinGecko data.
response = requests.get(url, params=params)
response.raise_for_status()
# Convert data from Json type to Python type.
data = json.loads(response.text)

# Analyze Coingecko data.
...
データは requests により取得します。取得するデータの詳細は requests に指定するURL、及びパラメーターにより決定します。
url = 'https://api.coingecko.com/spi/v3/coins/'+'識別ID'+'/market_chart'URLには下記を指定します。
- 識別ID:取得する仮想通貨のID
- 属性:どのデータを取得するか
1. は 3.1. 識別IDの確認方法 で確認した各仮想通貨固有の識別IDを指定します。
2. は仮想通貨のどのようなデータを取得したいかの項目になります。今回は市場価格の推移データを取得したいので market_chart となります。
データ取得のリクエスト送信時に指定するパラメーターは下記を指定します。
params = {
    'vs_currency': 'jpy',    # currency unit:JPY.
    'days': 7                # last 7days data.
}上記指定では「過去7日間のデータを日本円単位で取得する」という設定になります。
データはjson形式で取得されるため、これをPython形式に変換してデータを保持しておきます。
data = json.loads(response.text)その後は変換したデータから自分の欲しいデータを取り出して好きなように加工・分析すればOKです。
4. 仮想通貨(SHIB)チャートを透明OLEDモジュールへ表示
いよいよ透明OLEDモジュールにチャートを表示します。今回はSHIBで例を取り上げますが、識別IDを 変更することで、他の仮想通貨へ対応可能です。
サンプルプログラムと実行結果は下記になります。
##################################################
# Contents : Draw crypt prices on OLED DISPLAY.
# Author   : sinmorinokuma.
# Date     : 2024/04/21 New Create.
##################################################
from luma.core.interface.serial import spi
from luma.oled.device import ssd1306
from luma.core.render import canvas
from PIL import ImageFont
import RPi.GPIO as GPIO
import requests
import json
from datetime import datetime
import time
from statistics import mean, median

GPIO.setwarnings(False)

# List.
str_list = ['shiba-inu', 'SHIB']

# CoinGecko URL Settings.
url = 'https://api.coingecko.com/api/v3/coins/'+str_list[0]+'/market_chart'
# CoinGecko API Prameter.
params = {
    'vs_currency': 'jpy',  # currency unit:JPY.
    'days': 7              # last 7days data.
}

# SPI Connection Settings.
serial = spi(device=0, port=0, gpio_DC=25, gpio_RST=27)
device = ssd1306(serial)

# Font Settings.
font_path = "/usr/share/fonts/truetype/takao-gothic/TakaoGothic.ttf"
font = ImageFont.truetype(font_path, 11)
font_s = ImageFont.truetype(font_path, 8)

# Draw Function(Line)
def draw_dotted_line(draw, start, end, interval=3, dot_length=1):
    x1, y1 = start
    x2, y2 = end
    total_length = ((x2 - x1) ** 2 + (y2 - y1) ** 2) ** 0.5
    num_dots = int(total_length / interval)

try:
    while True:
        # Get CoinGecko data.
        response = requests.get(url, params=params)
        response.raise_for_status()
        # Convert data from Json type to Python type.
        data = json.loads(response.text)
        # Get data by 'prices'key.
        prices = [x[1] for x in data['prices']]

        # Sort data.
        sorted_prices = sorted(prices)
        prices_len = len(sorted_prices)

        # Calculate max, min and median.
        min_price = min(prices)
        max_price = max(prices)

        # Change format.
        formatted_max_price = f"{max_price / 1_000_000:.1f}M"
        formatted_min_price = f"{min_price / 1_000_000:.1f}M"

        # Latest price.
        last_price = prices[-1]
        # Change format.
        formatted_price = "{:.06f}".format(last_price)

        # Set device size.
        width = device.width
        height = device.height

        # Set margin.
        top_margin = 13
        bottom_margin = 0
        left_margin = 22
        right_margin = 0
        inner_margin = 3

        # Calculate grapho area.
        graph_width = width - left_margin - right_margin
        graph_height = height - top_margin - bottom_margin

        # Draw graph.
        with canvas(device) as draw:
            # Display the latest price of crypt on top.
            draw.text((28, 0), f"{str_list[1]}:{formatted_price}円", font=font, fill="white")
            # Display max, min, median price.
            draw.text((0, 10), formatted_max_price, font=font_s, fill="white")
            draw.text((0, 55), formatted_min_price, font=font_s, fill="white")

            # Draw prices data as line on graph.
            for i in range(1, len(prices)):
                x1 = left_margin + inner_margin + (i - 1) * ((graph_width - inner_margin * 2) / (len(prices) - 1))
                y1 = top_margin + inner_margin + (graph_height - inner_margin * 2) - ((prices[i - 1] - min_price) / (max_price - min_price) * (graph_height - inner_margin * 2))
                x2 = left_margin + inner_margin + i * ((graph_width - inner_margin * 2) / (len(prices) - 1))
                y2 = top_margin + inner_margin + (graph_height - inner_margin * 2) - ((prices[i] - min_price) / (max_price - min_price) * (graph_height - inner_margin * 2))

                # Draw line.
                draw.line([(x1, y1), (x2, y2)], fill="white")

            # Draw out line on graph.
            draw.rectangle([left_margin, top_margin, left_margin + graph_width - 1, top_margin + graph_height - 1], outline="white")

            # Draw line on graph(horizontal).
            middle_y = top_margin + graph_height / 2
            draw_dotted_line(draw, (left_margin, middle_y), (width - right_margin - 1, middle_y))

            # Draw two lines on graph(vertical).
            third_x1 = left_margin + graph_width / 3
            third_x2 = left_margin + 2 * graph_width / 3
            draw_dotted_line(draw, (third_x1, top_margin), (third_x1, height - bottom_margin - 1))
            draw_dotted_line(draw, (third_x2, top_margin), (third_x2, height - bottom_margin - 1))

        # Show now time onShell.
        now = datetime.now()
        fetched_time = now.strftime('%Y-%m-%d %H:%M:%S')
        print(f"取得時刻: {fetched_time}")

        # Wait update interval.
        time.sleep(600)

# If Get IOError.
except IOError as e:
    print(e)

# If Interrut(Input keyboard).
except KeyboardInterrupt:
    print("プログラムを終了します")

# Finally proc.
finally:
    # clear display.
    with canvas(device) as draw:
        pass
    # Cleanup GOIP(Set default state).
    GPIO.cleanup()
CoinGecko等の外部サーバーから連続的にデータを取得する場合は、取得間隔(インターバル)に注意してね!!!
短い時間に連続的にサーバーにアクセスするとサーバーに負荷が掛かって、場合によってはアクセス禁止されることがあるよ!
サンプルプログラムでは10分置きにデータを取得する設定になってるよ。
time.sleep(600)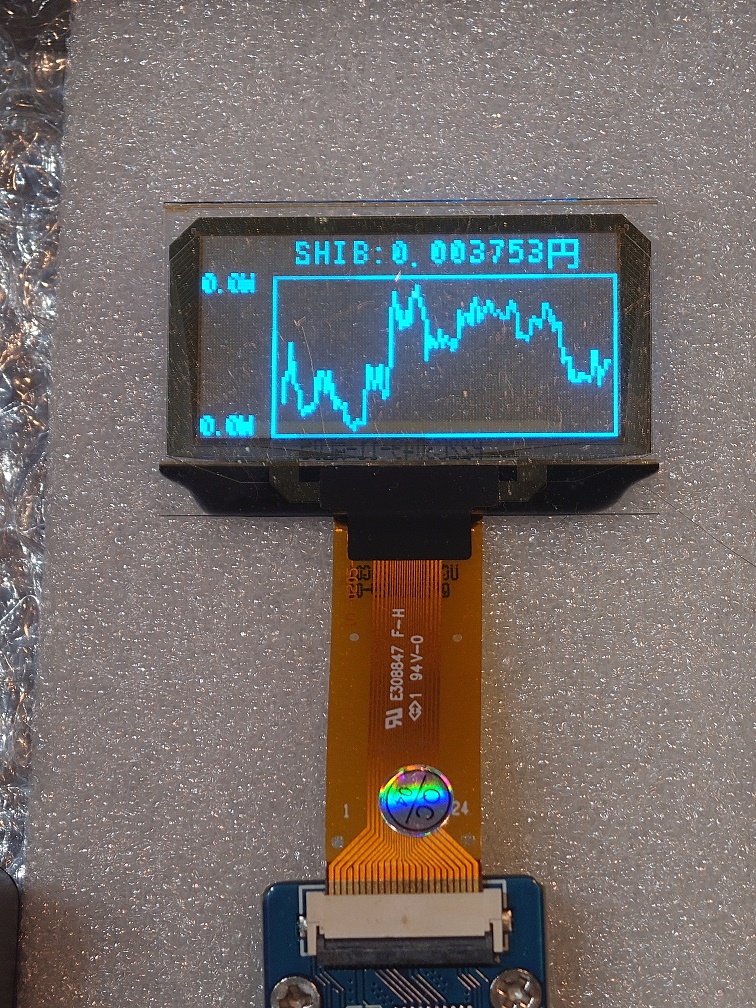
無事、仮想通貨SHIBのチャートが表示されました。これで仮想通貨チャートデバイスの完成です。
5. まとめ
いかがでしたか?
チャートを見るのが楽しくなっちゃいますね!
仮想通貨投資を実施している人はこのデバイスを使って楽しく投資を、まだ実施していない人はこれを機に仮想通貨投資を始めてみてはいかがですか?
※投資に関しては当方は一切責任を負いませんので、自己責任で実施してください。


コメント